Quick answer:
- An IT dashboard for owners only needs to answer three questions: are systems running well, is data safe, and what costs and risks are coming.
- 8 metrics to include: open tickets, SLA attainment, backup status, security alerts, devices due for replacement, expiring licenses, maintenance schedule and recurring incidents.
- Data should flow automatically from ticketing, backup and inventory systems, not be compiled by hand each month.
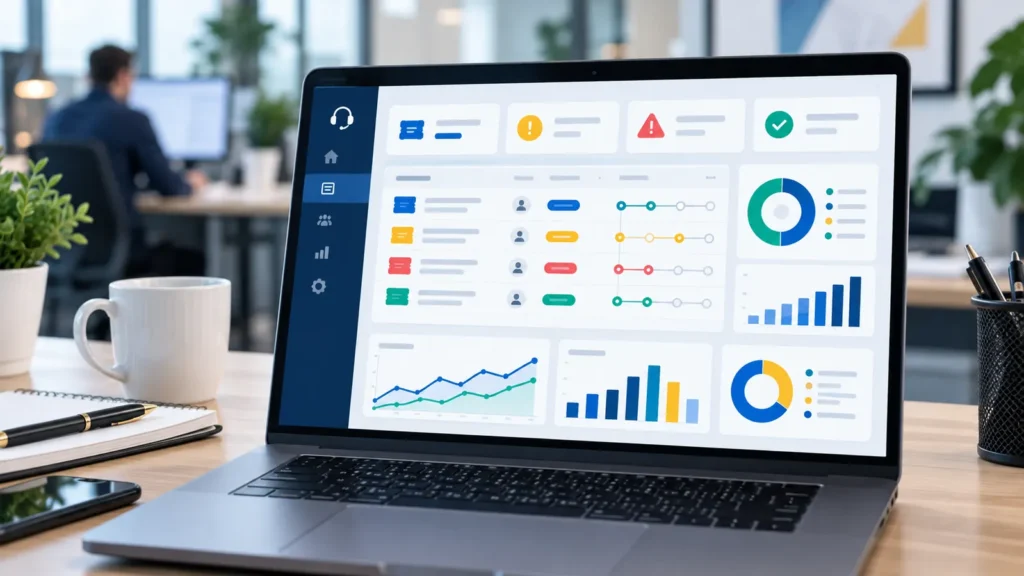
Monthly IT reports often run several pages of jargon and reach the director after problems have already happened. A single summary screen lets owners see IT health in one minute, at any time, and dig deeper only when a metric turns red.
8 metrics for an IT dashboard
| Metric | Question it answers | Suggested alert threshold |
|---|---|---|
| Open and overdue tickets | Are staff blocked from working? | Any overdue high-priority ticket |
| Monthly SLA attainment | Is the IT provider meeting its commitments? | Below 90% |
| Last successful backup | If data were lost today, how far back could we restore? | No successful backup in 24 hours |
| Security / data leak alerts | Is anything unusual happening with company data? | Unresolved high-severity alert |
| Devices out of warranty or aging | What replacement budget is needed next year? | PCs over 5 years, servers out of warranty |
| Expiring licenses, domains, certificates | Is anything about to stop working? | Under 30 days left |
| Maintenance schedule and reports | Is maintenance done on time? | Overdue visit without a report |
| Recurring incidents | Which issue costs the most time? | Same issue 3+ times a month |
Design principles for a readable IT dashboard
- Status colors: green, amber, red; avoid complex charts.
- One headline number per metric, compared with last month.
- Click through for detail (ticket list, backup jobs) instead of cramming everything on screen.
- Automatic data from ticketing, backup and inventory tools; hand-compiled figures are slow and error-prone.
- Mobile access for a quick look away from the office.
Dashboard vs monthly IT report
A dashboard shows status right now; a monthly report explains trends, causes and recommendations. Businesses need both: the dashboard for daily monitoring, the report for decisions. See the monthly IT support report template and measuring IT support with KPIs and SLA.
One screen in ITS Manager
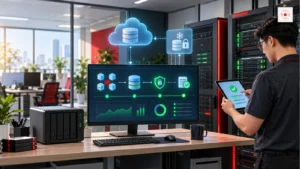
ITS Manager, software developed by IT Systems, combines five modules on one platform: DLP, Backup (SQL and data), Asset Management, IT Support and IT Care. The IT Support module lets customers view tickets and SLA in real time and shows a consolidated report of all modules on one screen: tickets, backup status, DLP alerts, assets and maintenance schedule. Owners no longer wait for month-end or chase the IT team for updates.
FAQ
Does a 20-person company need an IT dashboard?
Yes, if IT is outsourced or the company holds important data such as accounting or customer records. A dashboard lets you check the provider’s commitments without technical knowledge.
Can an IT dashboard be built in Excel?
At the start, yes, but manual updates make it slow and incomplete. Once you have ticketing and backup systems, use a dashboard that pulls data automatically.
What is the most important metric?
For most businesses: the last successful backup date and the number of overdue high-priority tickets, because they reflect the risk of data loss and work disruption.
Want to see your company’s IT status on one screen? Contact IT Systems for an ITS Manager demo or learn about our IT Support services with transparent reporting.